
The map hidden in the sales ledger: what India’s medicine sales could show about the patients nobody is treating
Drug companies know, town by town and month by month, where their blood-pressure pills sell. Read the other way, the same ledger shows where they don’t, and in India that is often where people with high blood pressure are going untreated. Governments, NGOs and CSR funders could use that map. Someone has to decide who holds it.
About this essay. The people in the opening and closing scenes are composites. Every number is real and sourced at the end. The district map is our own calculation from published survey data, and where we infer rather than report, we say so.
A quarterly review in Mumbai
On the last Thursday of the quarter, a brand manager we will call Neha opens the review deck for her company’s biggest blood-pressure brand. Slide fourteen is the one her director always asks about. It ranks every district in her region by sales per thousand adults, against what the district “should” sell given its population and income. Marketers call the gap white space.
At the bottom of the ranking sit three districts in the east of her territory. Sales there are a fraction of the regional average and have barely moved in two years. The recommendation on the slide is the sensible commercial one: low potential, deprioritise. Two medical representatives will move to the state capital, where doctors write more prescriptions and chemists stock more brands.
Neha has just found something more important than a weak market, and her deck has no way to say so. A district where blood-pressure medicine does not sell is either a district where few people have high blood pressure, or one where many people have it and nobody is treating them. Her ledger cannot tell the two apart on its own. Put it next to a health survey, and it can.
A pharma company’s white space is a public-health blind spot. They are the same rows in the same spreadsheet.
The disease that leaves no receipt
High blood pressure is the clearest test of this idea, because it is common, cheap to treat and almost silent. Most people who have it feel nothing until a stroke or heart attack. The largest study of the problem in India, published in JAMA Network Open in 2023, used the fifth National Family Health Survey to measure the blood pressure of about 1.7 million adults in 2019–21. It found that 28.1% had hypertension. Of those, 36.9% had been diagnosed. Of the diagnosed, 44.7% were taking medicine, which means only 17.7% of everyone with hypertension was being treated. Only 8.5% had it under control.
The World Health Organization’s first global report on hypertension, in 2023, put the number of Indian adults aged 30 to 79 with the condition at 188.3 million, of whom 37% had been diagnosed and only about 15% had it under control. It estimated that India would need to treat another 67 million people effectively to bring half of all patients under control.
The government is working hard on the problem. Its “75/25” initiative, launched in May 2023, aimed to put 7.5 crore people with hypertension or diabetes on standard care by the end of 2025. By March 2025, the health ministry told Parliament, 4.2 crore were being treated for hypertension and 2.5 crore for diabetes, close to 90% of the target.
The trouble is the people outside those numbers. A patient on treatment leaves a trail: a clinic visit, a prescription, a strip of tablets bought every month. An untreated patient leaves nothing at all. You cannot count them from the records of a system they never entered. You can only find them by noticing the transactions that should have happened and didn’t.
What the ledger already knows
Noticing missing transactions is what a sales team does for a living. India’s retail pharmaceutical market was worth ₹2,40,672 crore in 2025, according to Pharmarack, which audits what chemists buy and sell. Heart and blood-pressure medicines were its largest growth engine: the cardiac segment was worth about ₹33,115 crore in the year to December 2025, and antihypertensives made up roughly half of that. By our arithmetic, Indians spend something like ₹16,000 crore a year in pharmacies on blood-pressure pills alone.
Every one of those sales is recorded at least twice: once by the stockist who sells to the chemist, and again by the auditors who sample chemists across the country. Large companies combine the two into monthly views of every molecule, brand and town they sell in. They use that view for three things that matter here.
- Demand sensing: what is selling, where, this month, compared with last year.
- White-space analysis: where a category sells far less than population, income and doctor numbers predict.
- Lapse tracking: where repeat purchases fall away, which in a chronic medicine usually means patients have stopped taking it.
Each answers a commercial question. Turned around, each answers a public-health one. Where is the category under-selling? Where are patients undiagnosed or untreated? Where do repeat purchases fall away? Where are patients giving up on treatment? Pharma companies do not set out to collect public-health intelligence. They collect it anyway, as a by-product of selling, and almost nobody outside marketing ever reads it that way.
Need against demand: the quadrant
The idea at the centre of this essay is simple enough to draw. Plot every district twice: once for how much a disease is there (need), and once for how much treatment for it is being bought or dispensed (demand). Four kinds of district appear, and each calls for a different response from a different owner.
More medicine than the disease explains. Possible overuse, or patients travelling in from elsewhere.
Who acts: drug regulators and stewardship programmes, especially for antibiotics and steroids.
Patients are being treated, but probably paying for it themselves, month after month.
Who acts: health departments and insurers, with free public supply, generics and cheaper refills.
Little disease and little treatment. Nothing obviously wrong.
Who acts: nobody urgently. Keep watching for change.
Plenty of disease, little treatment. The untreated are here.
Who acts: governments, NGOs and CSR funders, with screening, clinics, free medicines and follow-up.
Need comes from health surveys. Demand can come from pharmacy sales, public dispensing records or survey questions about treatment. The bottom-right box is the map this essay is about.
The quadrant is not new as a shape. Every brand team has a version, usually labelled “invest”, “defend”, “harvest” and “ignore”. What is new is the question it is asked. A brand team asks where the next rupee of sales will come from. A health funder would ask where the next rupee of help will do the most good. The bottom-right corner is unattractive to the first and the whole point for the second.
Drawing the map with public data
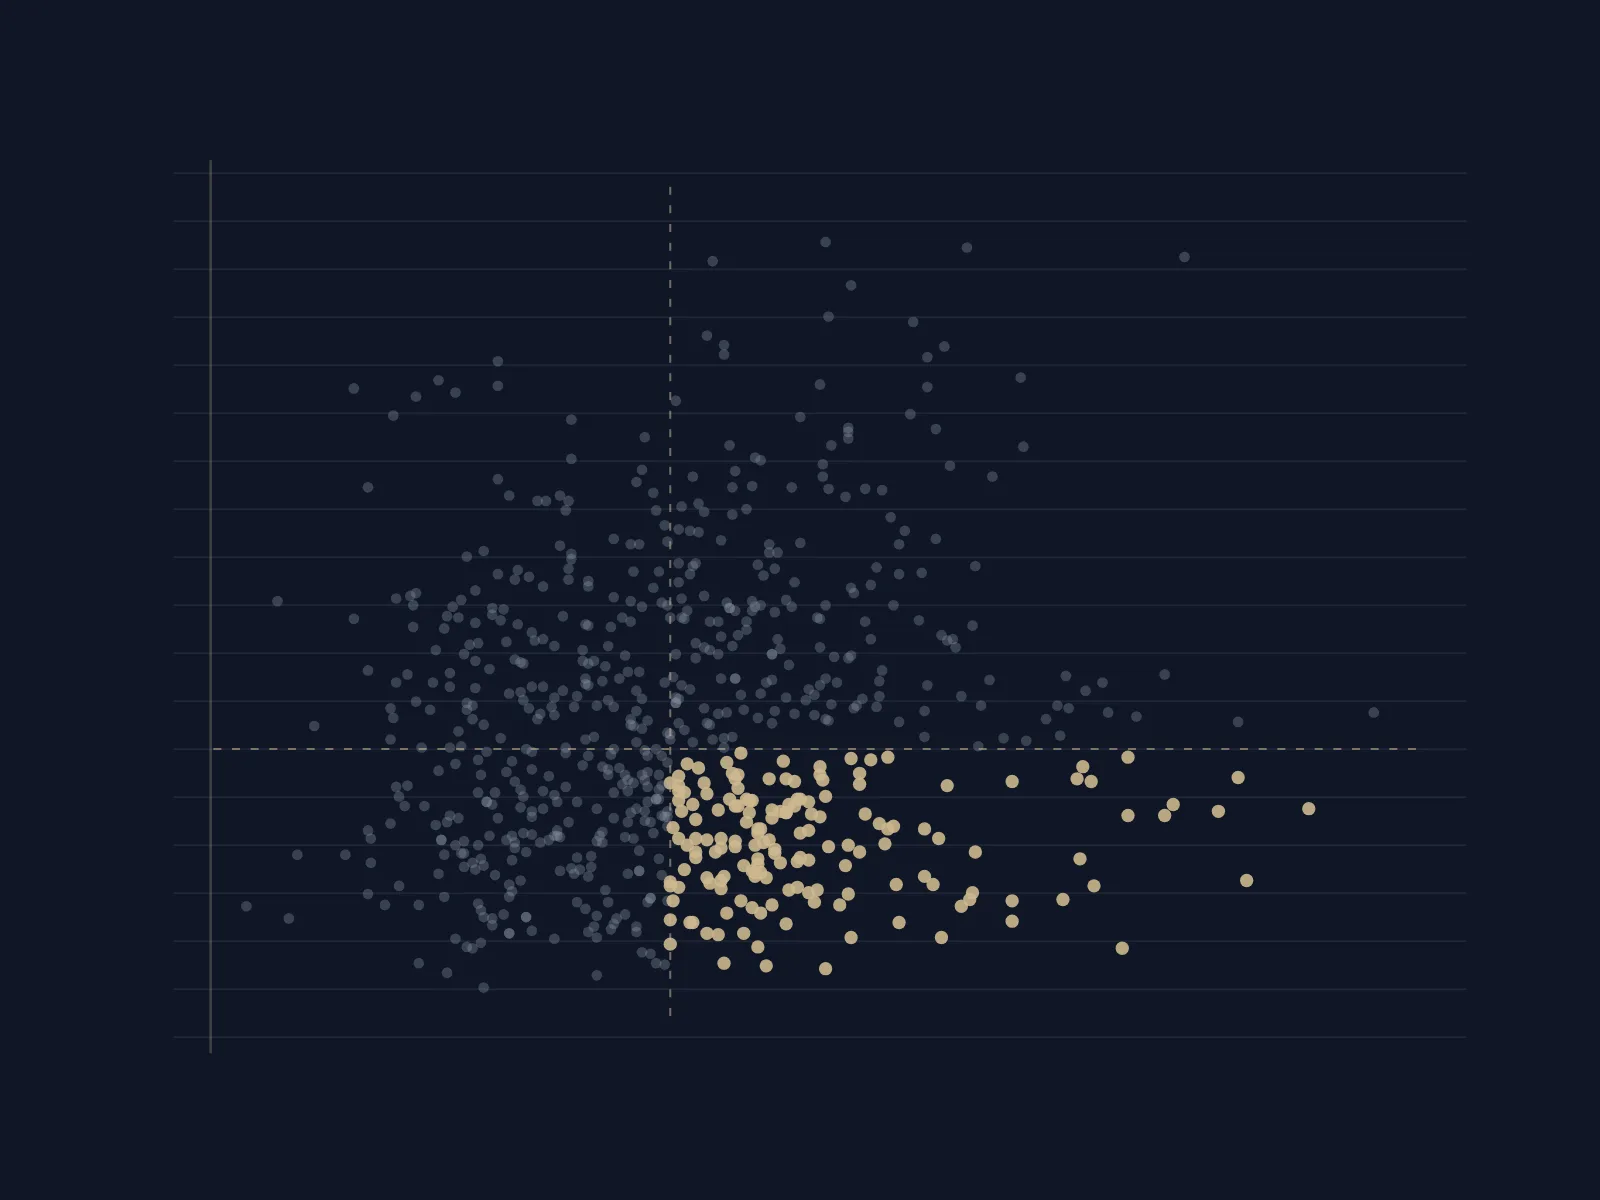
You do not need any company’s sales data to see that the map is worth drawing. The authors of the JAMA Network Open study published their district estimates, and they include a stand-in for demand: the share of people with hypertension who say they take medicine for it. We plotted all 707 districts in the survey against two medians: 27.7% of adults with hypertension, and 19.5% of them on treatment.
Each dot is a district. Dashed lines are the medians across all 707 districts. Treatment is the share of adults with hypertension who report taking medicine. Our calculation from the study’s published replication files; district estimates rest on samples of about 2,400 adults each, so individual dots are uncertain.
Three things stand out.
Need and care barely track each other. If treatment followed disease, the dots would slope upwards: more patients, more prescriptions. They don’t. Across the 707 districts, the correlation between the two is about 0.1, which is close to none. Where people are sick and where they are treated are almost separate questions.
The underserved corner is crowded. 161 districts sit in the bottom-right box, above the median for hypertension and below it for treatment. In 98 districts, fewer than one in ten people with high blood pressure take anything for it. Amritsar has one of the highest rates of hypertension in the country, at 47% of adults, and only 15% of them are treated. In Mirzapur in Uttar Pradesh it is 40% and 8%. In Anjaw, in Arunachal Pradesh, 44% and 5%.
The worst gaps hide inside good state averages. Funders tend to think in states. The map says they should think in districts. The same state can contain some of the best-served and worst-served places in India.
Share of adults with hypertension who report taking medicine. Each dot is a district; the labels mark each state’s lowest and highest. Our calculation from the study’s published replication files.
In Gujarat, 46% of people with hypertension in Ahmedabad take medicine for it, against 6% in The Dangs. In Odisha the range runs from 37% in Khordha, home to Bhubaneswar, to 9% in Koraput. In Maharashtra, from 40% in Mumbai Suburban to 15% in Nandurbar. Many of the lowest-ranked districts, including The Dangs, Nandurbar, Koraput and Alirajpur in Madhya Pradesh, have large tribal populations. The study’s data show the same pattern nationally: only 24% of people with hypertension from Scheduled Tribes had been diagnosed, against 40% in the general category.
The study’s authors concluded that local data are critical for planning and monitoring hypertension care. We agree. The difficulty is that this map is already five years old. The fieldwork ran from 2019 to 2021. The sixth survey’s fact sheets came out in May 2026, but analyses of this kind take years to follow, and a district that started a screening drive last spring will not see its effect in a national survey until the end of the decade. A sales ledger refreshes every month.
Where the ledger would sharpen the map
Put pharmacy sales next to the survey, and the map gains three things it does not have today.
Time. A survey every five years cannot tell a district officer whether last quarter’s screening camps turned into patients who keep buying their tablets. Monthly sales can, at least roughly. A rise in new prescriptions for amlodipine or telmisartan after a screening drive is a sign the drive found people. A rise that fades after three months is a sign they were not kept on treatment.
Detail. A survey of about 2,400 adults per district can just about rank districts. Sales are recorded by town and by chemist, which in principle allows a view below the district, down to the blocks and market towns where help would actually be delivered.
Breadth. The same method works for any chronic disease with a medicine and a survey estimate: diabetes, asthma, thyroid disease, and conditions like depression whose treatment gap is even larger and harder to see.
Where the ledger would mislead
The ledger is a proxy, and proxies fail in predictable ways. Anyone who builds this map has to plan for at least four.
Free medicine leaves no sale. Ayushman Arogya Mandirs, India’s upgraded primary health centres, are meant to give more than 170 essential medicines free, including those for blood pressure. Tamil Nadu goes further: its Makkalai Thedi Maruthuvam programme, launched in 2021, takes blood-pressure and diabetes medicines to patients’ homes, and the state says it had reached two crore people by December 2024. In a district like that, low pharmacy sales may mean the state is doing its job, not that patients are neglected. The same is true, in part, of more than 20,000 Jan Aushadhi generic-medicine stores, whose sales the government records but private audits may not. The map needs public dispensing data alongside private sales, or it will send help to the places that need it least.
Sales are booked where the shop is, not where the patient lives. A villager who buys tablets in the district town shows up in the town. Patients cross district and state lines for doctors and cheaper stockists. That smears the map at its edges, and favours aggregating to the level where it can be trusted.
A sale is not a patient. One patient may buy a month’s supply, another a week’s. Doctors switch brands, combine molecules and hand out samples. Converting sales into “patients on treatment” takes assumptions about dose and duration, and those assumptions should be published.
Signals drift. The best-known failure of this kind of data is Google Flu Trends, which estimated flu from search queries. Between August 2011 and September 2013, it overestimated flu in the United States in 100 of 108 weeks, because people’s searching habits, and Google’s own search engine, changed underneath the model. Sales change too: a price cut, a new combination pill or a distributor strike can move them without any change in disease. The answer is the one the flu researchers gave. Commercial data should complement surveys, not replace them, and the model should be recalibrated against every new survey round.
It has been done elsewhere
Reading commercial pharmacy data for public health is not a thought experiment. In the United States, the Centers for Disease Control and Prevention publish county-by-county maps of opioid prescribing built on IQVIA’s retail prescription data, which come from about 54,600 pharmacies. Those maps helped show where the opioid epidemic was being fed, years before overdose statistics caught up. In England, the NHS publishes anonymised data every month on what every general practice prescribes. An Oxford team turned it into OpenPrescribing, a free tool that lets anyone compare practices and spot unusual prescribing, and it is now funded by NHS England.
Neither example is a perfect fit. The American data are bought by the government from a commercial supplier, and English prescriptions come from a single public payer. India has neither arrangement. We found no public evidence that commercial pharmacy audits are shared with Indian health authorities for this purpose. That is the gap, and it is an organisational gap, not a technical one.
Follow the money
The map matters most to the people who decide where help goes, and Indian health money still moves largely by habit and headquarters. Companies spent ₹34,908.75 crore on corporate social responsibility in 2023–24, of which ₹7,150.81 crore, about a fifth, went to health. Projects in Maharashtra received ₹6,065.95 crore of the total, about 17%. Uttar Pradesh, home to about one in six Indians, received ₹1,545 crore, or 4.4%. Bihar received ₹260.53 crore. In 2022–23, the 112 aspirational districts that the government has picked out as the least developed received ₹1,402.89 crore, under 5% of the total.
The law encourages this. The Companies Act asks firms to “give preference to the local area and areas around it where it operates”, though the corporate affairs ministry has said the preference is directory, not mandatory. Plants and offices are where they are, and CSR follows them.
Lay that spending next to the hypertension map, and the mismatch is stark. Uttar Pradesh contains 37 of the 161 underserved districts, nearly a quarter. Maharashtra contains one. Madhya Pradesh, Chhattisgarh and Arunachal Pradesh together contain another 55. A CSR head who wants to fund hypertension care where it is missing would find the answer in this map, not in the company’s plant list. With sales data refreshed every month, she could also see whether her money had moved anything.
Who should hold the map
The most important question is not technical. Sales data are commercially sensitive, health data are personal, and a map of where poor people go untreated is exactly what an aggressive marketer would like to have. If the map is worth drawing, its governance has to be designed before the first file changes hands. We would build it on five principles.
- 1Counts, never people. The map needs units sold by molecule, district and month. It never needs a name, a phone number or a prescription. Data aggregated and anonymised that far is generally not personal data under India’s data protection law, and the Digital Personal Data Protection Rules, notified in November 2025 with most duties applying from May 2027, also allow processing for research and statistics that meets set standards. Small counts should be suppressed so that no village or chemist can be singled out.
- 2A neutral steward. No company should see a rival’s numbers, and no government should be the only reader. An independent body, such as a public research institute or an academic consortium, should receive the data, combine it across companies and publish only the joined-up map. That also keeps competition lawyers comfortable. India has the policy vocabulary for this: a government expert committee on non-personal data proposed “data trustees” and shared “high-value datasets” for public good in 2020, and the draft National Data Governance Framework Policy of 2022 invited private firms to contribute anonymised data voluntarily.
- 3A firewall against selling. Data shared for health must not flow back into targeting. Contributors should get the public map, not a privileged view of it, and the steward’s rules should forbid using the underserved list to aim promotions at poor patients.
- 4Public dispensing in the same frame. Free medicines from health centres, Jan Aushadhi sales and state schemes like Tamil Nadu’s must sit alongside private sales, or the map will mistake public success for neglect.
- 5Published methods and a sunset. The assumptions that turn sales into patients, the survey used to calibrate them, and the error bands should all be public. Any agreement should expire after a fixed term unless renewed, so that the arrangement earns its continuation.
What it means for you
- 1A pharma leader. Your white-space report is already a map of unmet need. Offer the aggregated version to a neutral steward. It costs little, and it is a more credible contribution to public health than another awareness camp.
- 2A CSR head or foundation board. Ask where your health money went last year, and lay it over the hypertension map. If it does not reach the bottom-right corner, ask why. Local-area preference is guidance, not a rule.
- 3A state health secretary or NHM director. Join your own dispensing data from health centres to survey estimates first. That alone will show you which districts look underserved, before any company shares anything.
- 4An NGO working on chronic disease. Use the published district estimates to choose where to work, and say so in your proposals. Funders respond to a map.
- 5A data person. The survey data, code and methods behind our charts are public. The hard parts are reconciling sales with dispensing, choosing dose assumptions and admitting the error bands.
- 6Anyone over 30. Have your blood pressure checked. It is free at government health centres, and most people with high blood pressure in India do not know they have it.
Why it could go wrong
The map could be used to sell, not to help. A list of districts where many people are untreated is also a list of untapped markets. That is not entirely bad, since more pharmacies stocking cheap generics would help, but a commercial push of expensive branded combinations into poor districts would raise costs for the people least able to pay. The firewall in principle three is the safeguard, and it needs teeth.
The map could replace the people who should check it. A dashboard is cheaper than a household survey and much cheaper than a health worker. If funders start trusting the sales map instead of the survey and the ASHA, the Google Flu Trends lesson will be relearned at patients’ expense.
The map could punish the honest. Districts that report their dispensing carefully will look better served than districts that don’t. Unless public data are complete, the map will reward poor record-keeping with attention it may not deserve, and the reverse.
The map could stop at diagnosis. Finding untreated patients is the easy half. Keeping them on treatment for decades is the hard half, and it needs clinics, supplies and people. A map that moves money to the right districts but not into follow-up will simply produce a new crop of patients who start treatment and stop.
What should happen next
- Redraw the need-and-care map from the latest survey data as each state’s figures appear
- Join it to health-centre dispensing and Jan Aushadhi sales
- Publish a ranked list of underserved districts for funders
- Two or three volunteer states and a few companies share aggregated sales of blood-pressure and diabetes medicines
- A neutral steward combines them under published rules
- Test whether the monthly map tracks the survey, and where it doesn’t
- A standing health-demand commons covering the main chronic diseases
- CSR and NHM budgets that cite the map when they choose districts
- An annual public report on whether the underserved corner is shrinking
RavenArc tests every decision against six questions. For a company board or a CSR committee deciding whether to contribute to a map like this, they make a short agenda.
- 1Frame the decision. Are we deciding whether to share data, or how to share it safely? The second is the real decision.
- 2Size the stakes. How many untreated patients sit in the districts where we sell least, and what is the cost of their strokes and heart attacks, to them and to the health system?
- 3Map real alternatives. Share through a neutral steward, share with one state, fund an independent survey instead, or do nothing. What does each cost and protect?
- 4Surface the assumptions. That aggregated sales cannot identify anyone, that rivals cannot reverse-engineer our share, that low sales mean untreated patients. Which can we test before we commit?
- 5Set signposts and triggers. If the map stops matching the survey, or if anyone uses it to target promotions, what happens automatically?
- 6Assign decision rights. Who in the company can approve sharing, and who outside it can stop the arrangement if the rules are broken?
The same review, a year later
Run the quarter again. Neha’s deck still has slide fourteen, and the same three districts are still near the bottom. This time there is a second slide behind it, drawn from the shared map. Two of the three districts sit in the underserved corner: high blood pressure is common there, and treatment is rare. The third turns out to be well served after all, by a state scheme that hands out free tablets her ledger never saw.
Nothing about Neha’s job has changed. She still has to sell. But her company’s aggregated figures now feed a monthly map that a district health officer, a CSR committee in Mumbai and an NGO in the state capital all read. One of them has already moved a screening programme into the two underserved districts. In six months, the map will show whether the people it found are still buying their tablets.
India already keeps a monthly record of where its medicines sell. The map of where they don’t is in the same ledger. Someone only has to read it the other way.
What would change our view
If aggregated pharmacy sales, once joined with public dispensing, did not track survey estimates of treatment across districts, the case for using them to find untreated patients would fall. So would evidence that districts could not be compared without revealing individual chemists or companies, or that shared data were used to target promotions rather than care.
Sources
- Varghese and colleagues, “Hypertension diagnosis, treatment, and control in India”, JAMA Network Open (October 2023) (full text), with its published replication files and district dashboard
- Down to Earth on the WHO Global report on hypertension (September 2023)
- Rajya Sabha, unstarred question 1383 on the 75/25 initiative (11 March 2025)
- The Tribune (ANI) on Pharmarack’s 2025 market data and BioSpectrum on the cardiac segment, MAT December 2025
- All India Radio on the release of the NFHS-6 fact sheets (May 2026)
- Rajya Sabha, unstarred question 2022 on free essential medicines at public facilities (March 2025) and NHSRC on the Free Drugs Service Initiative
- NewsDrum (PTI), Makkalai Thedi Maruthuvam reaches two crore beneficiaries (December 2024)
- Organiser on the number of Jan Aushadhi Kendras (July 2026)
- Lazer and colleagues, “The parable of Google Flu: traps in big data analysis”, Science (2014)
- Centers for Disease Control and Prevention, opioid dispensing rate maps and data sources
- OpenPrescribing, Bennett Institute for Applied Data Science, University of Oxford
- The CSR Journal, National CSR Portal data for 2023–24 and India CSR, state-wise CSR spending in 2023–24
- Press Information Bureau on CSR spending in aspirational districts (December 2024)
- Companies Act 2013, section 135 and Taxguru on the Ministry of Corporate Affairs’ CSR FAQs, General Circular 14/2021
- SCC Online on the Digital Personal Data Protection Rules 2025
- PRS Legislative Research on the revised report of the committee on non-personal data (December 2020)
- Observer Research Foundation on the draft National Data Governance Framework Policy (2022)
Facts are as reported by these sources. The opening and closing scenes are illustrative composites. The district charts, the 161 and 98 district counts, the correlation, the within-state ranges and the count of underserved districts by state are our calculations from the study’s published replication files; treatment shares computed this way run a little above the paper’s national headline figure, which uses a different estimation step, so we use them to compare districts rather than to state a national rate. The annual spend on blood-pressure medicines is our arithmetic.
RavenArc tests every decision against six questions. See the RavenArc Decision Method.
One considered idea, straight to your inbox.
A short note when we publish something worth a leader’s time. No noise, and you can leave with one click.